IV. Whom For?
4.1. Disabled and Disability
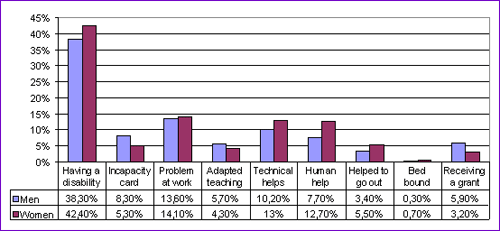
In 2001, French institute of statistics, INSEE (Institut National de la Statistique et des Études Économiques – National Institute of Statistics and Economical Studies), released the report of a survey on disability among the French population, called Handicap, Incapacity and Dependency (HID). The survey took place between 1998 and 2000 and covered the whole French population. The results of this survey particularly show that more than a third (40,4%) of the population answered "yes" to the question "In your everyday life, do you encounter any difficulties, whether they are physical, sensorial, intellectual or mental?", and that about a tenth (13,9%) of the same population was encountering problem at work due to a disability (INSEE, 2001). It is likely that since this survey was conducted and due to population aging, the percentage of people who would have answered "yes" to this question have increased.

Figure 4.1: Percentage of People with Disabilities (INSEE, 2001).
| People declaring | Men | Women | Both |
|---|---|---|---|
| Having a disability | 38.3% | 42.4% | 40.4% |
| Holding an Incapacity card | 8.3% | 5.3% | 6.8% |
| Encountering problems at work due to a disability | 13.6 | 14.1 | 13.9% |
| Following an adapted teaching | 5.7% | 4.3% | 5% |
| Needing technical helps | 10.2 | 13% | 11.6% |
| Needing human help | 7.7% | 12.7% | 10.3% |
| Being helped to go out | 3.4% | 5.5% | 4.4% |
| Being bed bound | 0.3% | 0.7% | 0.5% |
| Receiving a grant | 5.9% | 3.2% | 4.5% |
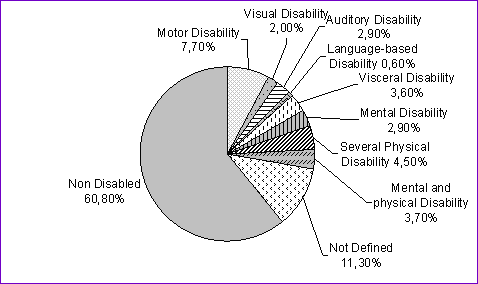
| Type of Disability | Number of People | Percentage of Population |
|---|---|---|
| Motor Disability | 4 401 883 | 7.7% |
| Visual Disability | 1 141 937 | 2% |
| Auditory Disability | 1 658 919 | 2.9% |
| Language-based Disability | 325 997 | 0.6% |
| Visceral Disability | 2 091 806 | 3.6% |
| Mental Disability | 1 645 132 | 2.9% |
| Several Physical Disability | 2 585 300 | 4.5% |
| Mental and Physical Disability | 2 145 845 | 3.7% |
| Not Defined | 6 477 415 | 11.3% |
| Total | 22 474 234 | 39.1% |

Figure 4.2: Repartition of Disabilities (INSEE, 2001).
The study particularly shows that having a disability does not always mean being heavily handicapped. But if having difficulties to concentrate, or shaking hands, or not being able to look at a computer screen for more than an hour are not considered disabilities in everyday life, they are on the Internet. Indeed, a website with a complicated structure and navigation will be inaccessible for the person who has difficulties to concentrate; small clicking area will be as well for the person with shaking hands; and a too strong contrast between text and background (for example white and black) will be difficult to read for the person whose eyes get rapidly tired when looking at a computer screen, or suffer from dyslexia or hyper sensitivity to light.
In some extent, we are all concerned with this kind a disturbance. We all have days where we are not able to fully concentrate on something because of a lack of sleep or an excess of stress; and we may all grew old someday and may encounter difficulties controlling our hands.
We are all concerned by web accessibility!
Among the 39% of people who admit having difficulties in their everyday life, there are 1 022 000 persons (representing 1,5% of the population) that are considered having a heavy deficiency.
| Heavy Deficiency | Number of People | Percentage of Population |
|---|---|---|
| Heavy Motor Deficiency | 720 000 | 0.9% |
| Total Visual Deficiency | 77 000 | 0.1% |
| Heavy Visual Deficiency | 225 000 | 0.5% |
These statistics are not specifics to the web activity, but give a good overview of the potential users of the internet suffering disability and thus more concerned by web accessibility than people who does not have any disability. It concerns between 30% and 35% of the population. For the 11.6% of the population who need personal help, web accessibility is a necessity; and for around 1.5% of the population suffering heavy disabilities, web accessibility is the only way to access web contents.